The Statistics-Concept
The definition and creation of statistics and simulations respectively in RSS-D is basically performed in two Steps.
Step 1 (STA-DEF)
Firstly you define the (statistics-)operations, wherefore you specify partitions, fee-definitions and other parameters for the summation-programs,
according to which these will pre-summate data in the background, transaction- or time-period-oriented, (or, in case of ad-hoc-operations, be initiated by the dialog-system to do so).

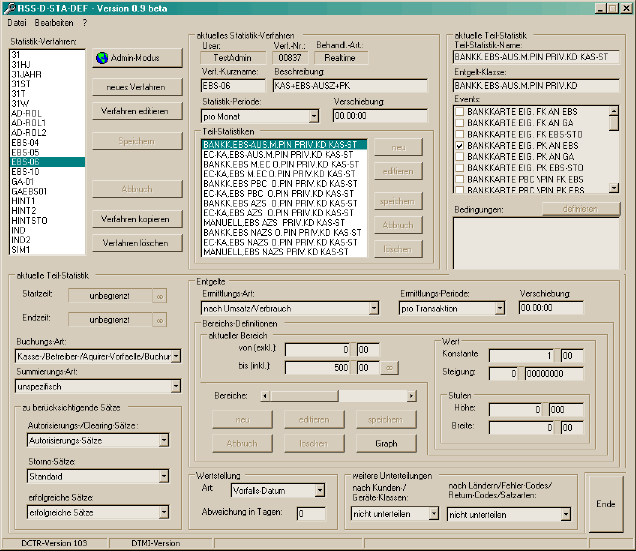
STA-DEF - main-dialog
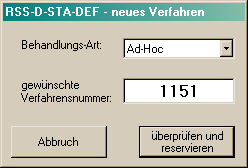
In order to define an operation you firstly reserve a number in a range that had been associated client-specifically with the desired treatment (ad hoc, background, realtime, simulation, condition). The next possible free number will be provided automatically:

Specifying a start- and expiration-time makes it possible, to define statistics, that include only specific ranges of time. When defining simulations (by appropriate aggregation mode) start-time should be past:
STA-DEF - reserving a new operation

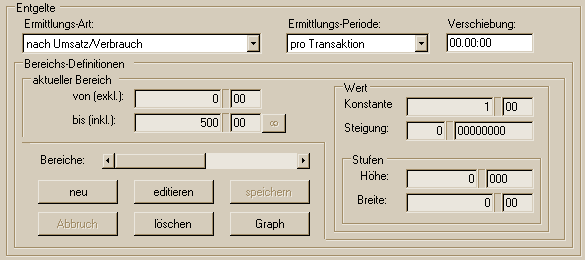
It is very easy to define fees, but RSS also gives consideration to more sophisticated structures.
You may assign an arbitrary quantitiy of ranges to constants,
arithmetically in- or decreasing or step functions, even in arbitrary combinations:
start- and expiration-time - section of the main-dialog

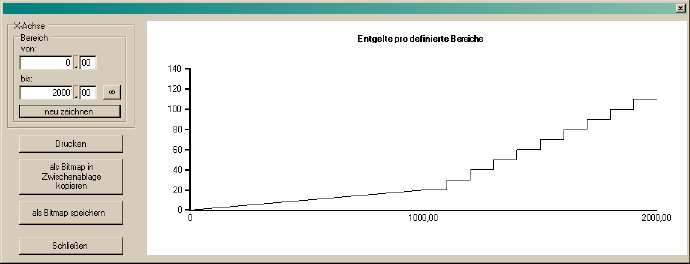
In doing so a visualization-dialog provides overview, also sections may be displayed:
fee-definition - section of the main-dialog

fee-visualization
Step 2 (STA-VIS)
Here you define your very individual statistics-charts. In a wide manner you may determine parameters, that will specify form and content of the
diagrams to display.
In addition you will find options to print or export your charts and data, for further reuse in applications like f. e. MS-Excel®.
STA-VIS-main-dialog
The visual specifications of every chart are stored in user-specific sets, therefore are to define only once and stay available.
You may associate the x-axis with every via
STA-DEF defined columns, even with different at the same time. The x-axis can be partitioned nested up to 4 times.
In addition STA-VIS provides the possibility to define multiple charts at once, through which you may easily navigate,
while being displayed realtime. This ‘browsing’ function may be nested up to 4 times likewise.
Normally STA-VIS gathers aggregation-informations for chart-visualization and simulation-results from the accordant database-table (DSUM) of the central RSS-system. Solely on ad-hoc-statistics the aggregation is initiated directly before visualization by calling the aggregation-subprogram (USUM). In this connection a user-defined set of transaction-informations, that had been defined via the dialog-application DTRA-DEF, is used as data source.
For more detailled description of the extensive options, especially concerning the application DTRA-ERF and chart-visualization let us refer you to the appropriate RSS-D-user-manual.
© Copyright 2006 SYSJM. All rights reserved.